"size" ignores features much larger than the typical pellet size. If a conventional pattern plate target with a bulls-eye and pre-marked segments is scanned-in, the "size" setting can suppress these features of the target.

| Decrease / increase the size of the image. Does not affect
pellet detection. |
Block a small, medium or large area of the image from automatic
pellet detection. Manually added pellets are unaffected. (see on-screen Blocked
Area) |
||
| Set active area button. Drag the boxes at the top-left and bottom-right
to set the area that will be scanned for pellet holes. |
|
Adjust the slider to set the automatic pellet detection level and give the best balance between not detecting true pellet marks and false pellet detection when the contrast between the pellet marks and background is poor. False detection can be blocked manually. Undetected pellets can be added manually. | |
| Set the scale of the image. Drag the
up/down arrows on the image
to indicate a known vertical distance on the image and the left/right
arrows to indicate a known horizontal distance. Move the graticule to
indicate the point of aim. |
"double" is used to detect near-coincident pellet strikes.
(NB this feature works best with larger pellets that give a well defined
and consistent impact mark. "size" ignores features much larger than the typical pellet size. If a conventional pattern plate target with a bulls-eye and pre-marked segments is scanned-in, the "size" setting can suppress these features of the target. |
||
| Manually add or delete single pellets. Clicking will add a 'manual'
pellet - shown as a blue marker. SHIFT+clicking over a manually generated
pellet mark will delete it. SHIFT+click over an automatically generated
pellet mark will exclude the pellet from the analysis. (see Manual
Pellet and Deleted Pellet
graphics) |
|
Horizontal / Vertical fields to enter the true distance indicated
by the scale setting arrows. |
|
|
|
Update the analysis panel with the latest status of the image. |
|
The distances may be input in imperial inches or metric cm.
However, all outputs are displayed in inches and graphical output is
shown with respect to a 30" and 20" circle. |

The text fields and drop-down selection boxes for the shell, gun, venue and date are for information only and play no part in the numerical analysis of the pattern.
The 'Scale' box does affect the calculations. It allows the pattern to be rescaled and its 75% spread diameter and hit probabilities calculated for different ranges. The 'Test dist' is the distance the target is shot at. The 'Scale' box allows an entry between 0.3 and 3.0. The 'Analysis dist' is the 'Test dist' multiplied by the 'Scale'. The effect of this 'Scale' function could be achieved by altering the distances in the Horiz Dist and Vert Dist. However, since the input image and its associated controls are not saved, it is best to store the raw data at true scale and then modify it using the 'Scale' control in the Header Panel. This makes it very easy to go back to the original true scale and allows the same pattern to be saved at different distances for later review of what the best range for the choke is, or alternatively, if the choke was optimum for the given range.
This 'Scale' function serves several purposes:
It should be noted that the path the pellets follow versus distance is a poorly understood science, or at best a disputed science! The scaling function should be taken as an estimate. It is best not to shoot at 25 yards, scale by a factor of three to 75 yards and expect this to be a reliable indicator of shell performance!
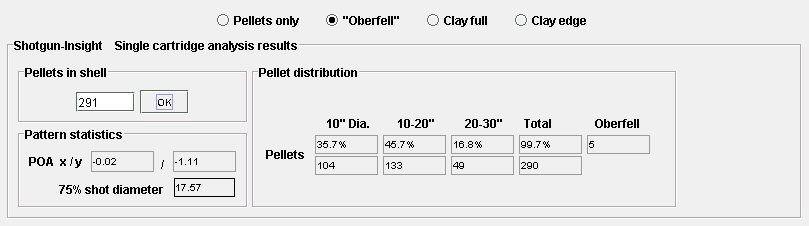
"Oberfell" shows discs 5" diameter without any pellet strikes. See The Mysteries of Shotgun Patterns for more information.
An edge-on clay is represented by a disc with the same area as an edge-on standard sized UIT clay as used in the UK (25mm high x 110mm diameter - Laporte. 26mm high x 110mm diameter - CCI ).
A "full-on" clay is represented by a disc of diameter 110mm (Laport, CCI data).
By passing these discs across the pattern of pellets, occasions when no pellets strike the disc can be displayed.
This text entry box allows the number of pellets in the shell to be entered so the percentage of pellets falling in the 10", 10-20" and 20-30" areas can be expressed as a percentage of the known pellet count in the shell. The pellets in the shell can added after the analysis has been saved and then loaded back. The pellet count should not be taken from tables, the declared shot size or declared charge weight. Very often the pellet count of commercial shells is very different to that expected. Also, it is best no to rely on the pattern plate because pellets can sometimes split and give extra strikes, or they can be so badly formed they miss the plate completely. The pellet count should be done by hand, or quicker still, spread the shot on to a light coloured piece of cloth, take a digital picture and then use Shotgun-Insight to count the pellets. Three shells can give some confidence in the pellet count.
"POA x/y" is the 'Point of Aim' with x= horizontal position, y= vertical position. This shows the relative position of the aiming point of the gun compared to the centre of mass of the pellets.
"75% shot diameter" should be read as the diameter inside which on average approximately 75% of the shot would fall. It is a convenient way of expressing the pattern in a single number that can be used to compare shells with different pellet counts.
10" Dia., 10-20", 20-30". This is simply the number of pellets falling within the regions indicated. Please note that 10-20" and 20-30" are annuli! The number of pellets inside the 30" circle is the 10" Dia. value plus the 10-20" value plus the 20-30" value. If the number of pellets in the shell has been entered the percentages are also shown.
The 'total' is all pellets detected. This may include outliers that are not shown on the analysis panel graphic.
'Oberfell'.
This is the number of non-overlapping 5" diameter discs that can be
positioned in the 30" circle without falling on a pellet. Please
note that the algorithm used under-reads if there are very few pellets
within the circle. According to Oberfell p47, an empty 30" circle can
accommodate 27 non-overlapping 5" discs. The algorithm as implemented
records approximately 22. It was beyond this author to come-up with a fast
algorithm for automatically replicating this result. However, for more
realistic results the algorithm is reliable. This can be shown by manipulating
pellets manually. It is also worth bearing in mind that the method of
drawing in circles by hand is also non-perfect!
How to deal with 'fliers' or outlier pellets is a difficult topic to resolve. In earlier versions of the software the advice given here was to ignore obvious 'fliers'. However, I'm now inclined to include all pellet marks. The reasons for this are:
Make sure that all pertinent information is marked on the target and captured by the digital camera. Notes can always be blocked from the analysis area. Make sure the reference distance is marked on the target for setting the image scale.
The Normal distribution features strongly in this analysis of shotgun patterns. The picture below illustrates its main features:
The graph shows the relative probability of an 'event' happening versus its distance from the mean (average) which in the picture above is shown as zero. It will be seen that the likelihood of an event occurring is greatest nearest the mean. The distance +/- "1-sigma" accounts for approximately 68% of events, the distance +/- 2-sigma for 95% of events and the +/- 3-sigma range accounts for 99.7% of all events. This type of distribution model fits many naturally occurring observations, for example, heights of people, test scores, examination marks etc. Oberfell and Thompson also found that the average pattern distribution from a shotgun could be modelled by the Normal distribution. It is important to note that the Normal distribution does not define the pellet distribution, it is just a model that fits the observed distributions quite well.
The value 'sigma' is used to indicate the width of the distribution. The value of sigma can be used to compare one shell against another for a given choke to see which holds the tightest pattern and hence which will be able to carry a useful pattern the longest distance. Alternatively, skeet shooters may be interested in obtaining the widest spread possible.
To demonstrate that the shell
and gun combination work well together, the patterns should be as
repeatable as possible in much the same way as a rifle shooter looks
for minimum variation shot to shot. The big difference is that rather
than measuring a single distance (the maximum spread), the shotgunner's
measure of repeatability is how all the pellets behave together. One
way of doing this is to fit all the pellet positions to a model and then
look at how the parameters of the model vary. In this case the Normal
distribution is employed as the model.
The main source of reference (and part inspiration) for this work is a wonderful little book by the title of, "The Mysteries of Shotgun Patterns" written by George G. Oberfell and Charles E. Thompson, published by Oklahoma State University Press, 1957.
As well as many, many test targets, this book in turn cites work done by others in their efforts to deduce how shotguns perform.
One over-arching finding of Oberfell and Thompson (henceforth O&T) is that on average, over a large-number of shots, the pellet distribution follows that of a 'Normal' (also known as Gaussian) distribution.
The method of rating a shotgun developed by O&T is based on counting the gaps in a pattern. To ensure there is a reasonable probability of a gap, the test distance is 40 yards and No.6 shot recommended. As well as ensuring a reasonable likelihood of having gaps to measure, the number of pellets is low enough to be counted by hand. Based on the performance at 40 yards, performance at closer distances can be deduced.
With the availability of fast,
low-cost computers the analysis can be more sophisticated. Performance at
closer ranges can be confirmed and repeatability shot-to-shot can
be investigated. However, generating more data then presents the problem
of how to interpret the results. One of the great strengths of the Oberfell
& Thompson method is that it rates the shotgun in simple terms
- normal, poor, excellent etc.
The "Numerical Recipes" series
is a great source for algorithms across a whole range of science,
engineering and maths. The Spearman Rank-Order Correlation algorithm came from Numerical
Recipes in C. Authors: William H. Press, Brian P. Flannery, Saul A.
Teukolsky, William T. Vetterling. Cambridge University Press, ISBN 0-521-35465-X.